PowerBI statistical analysis
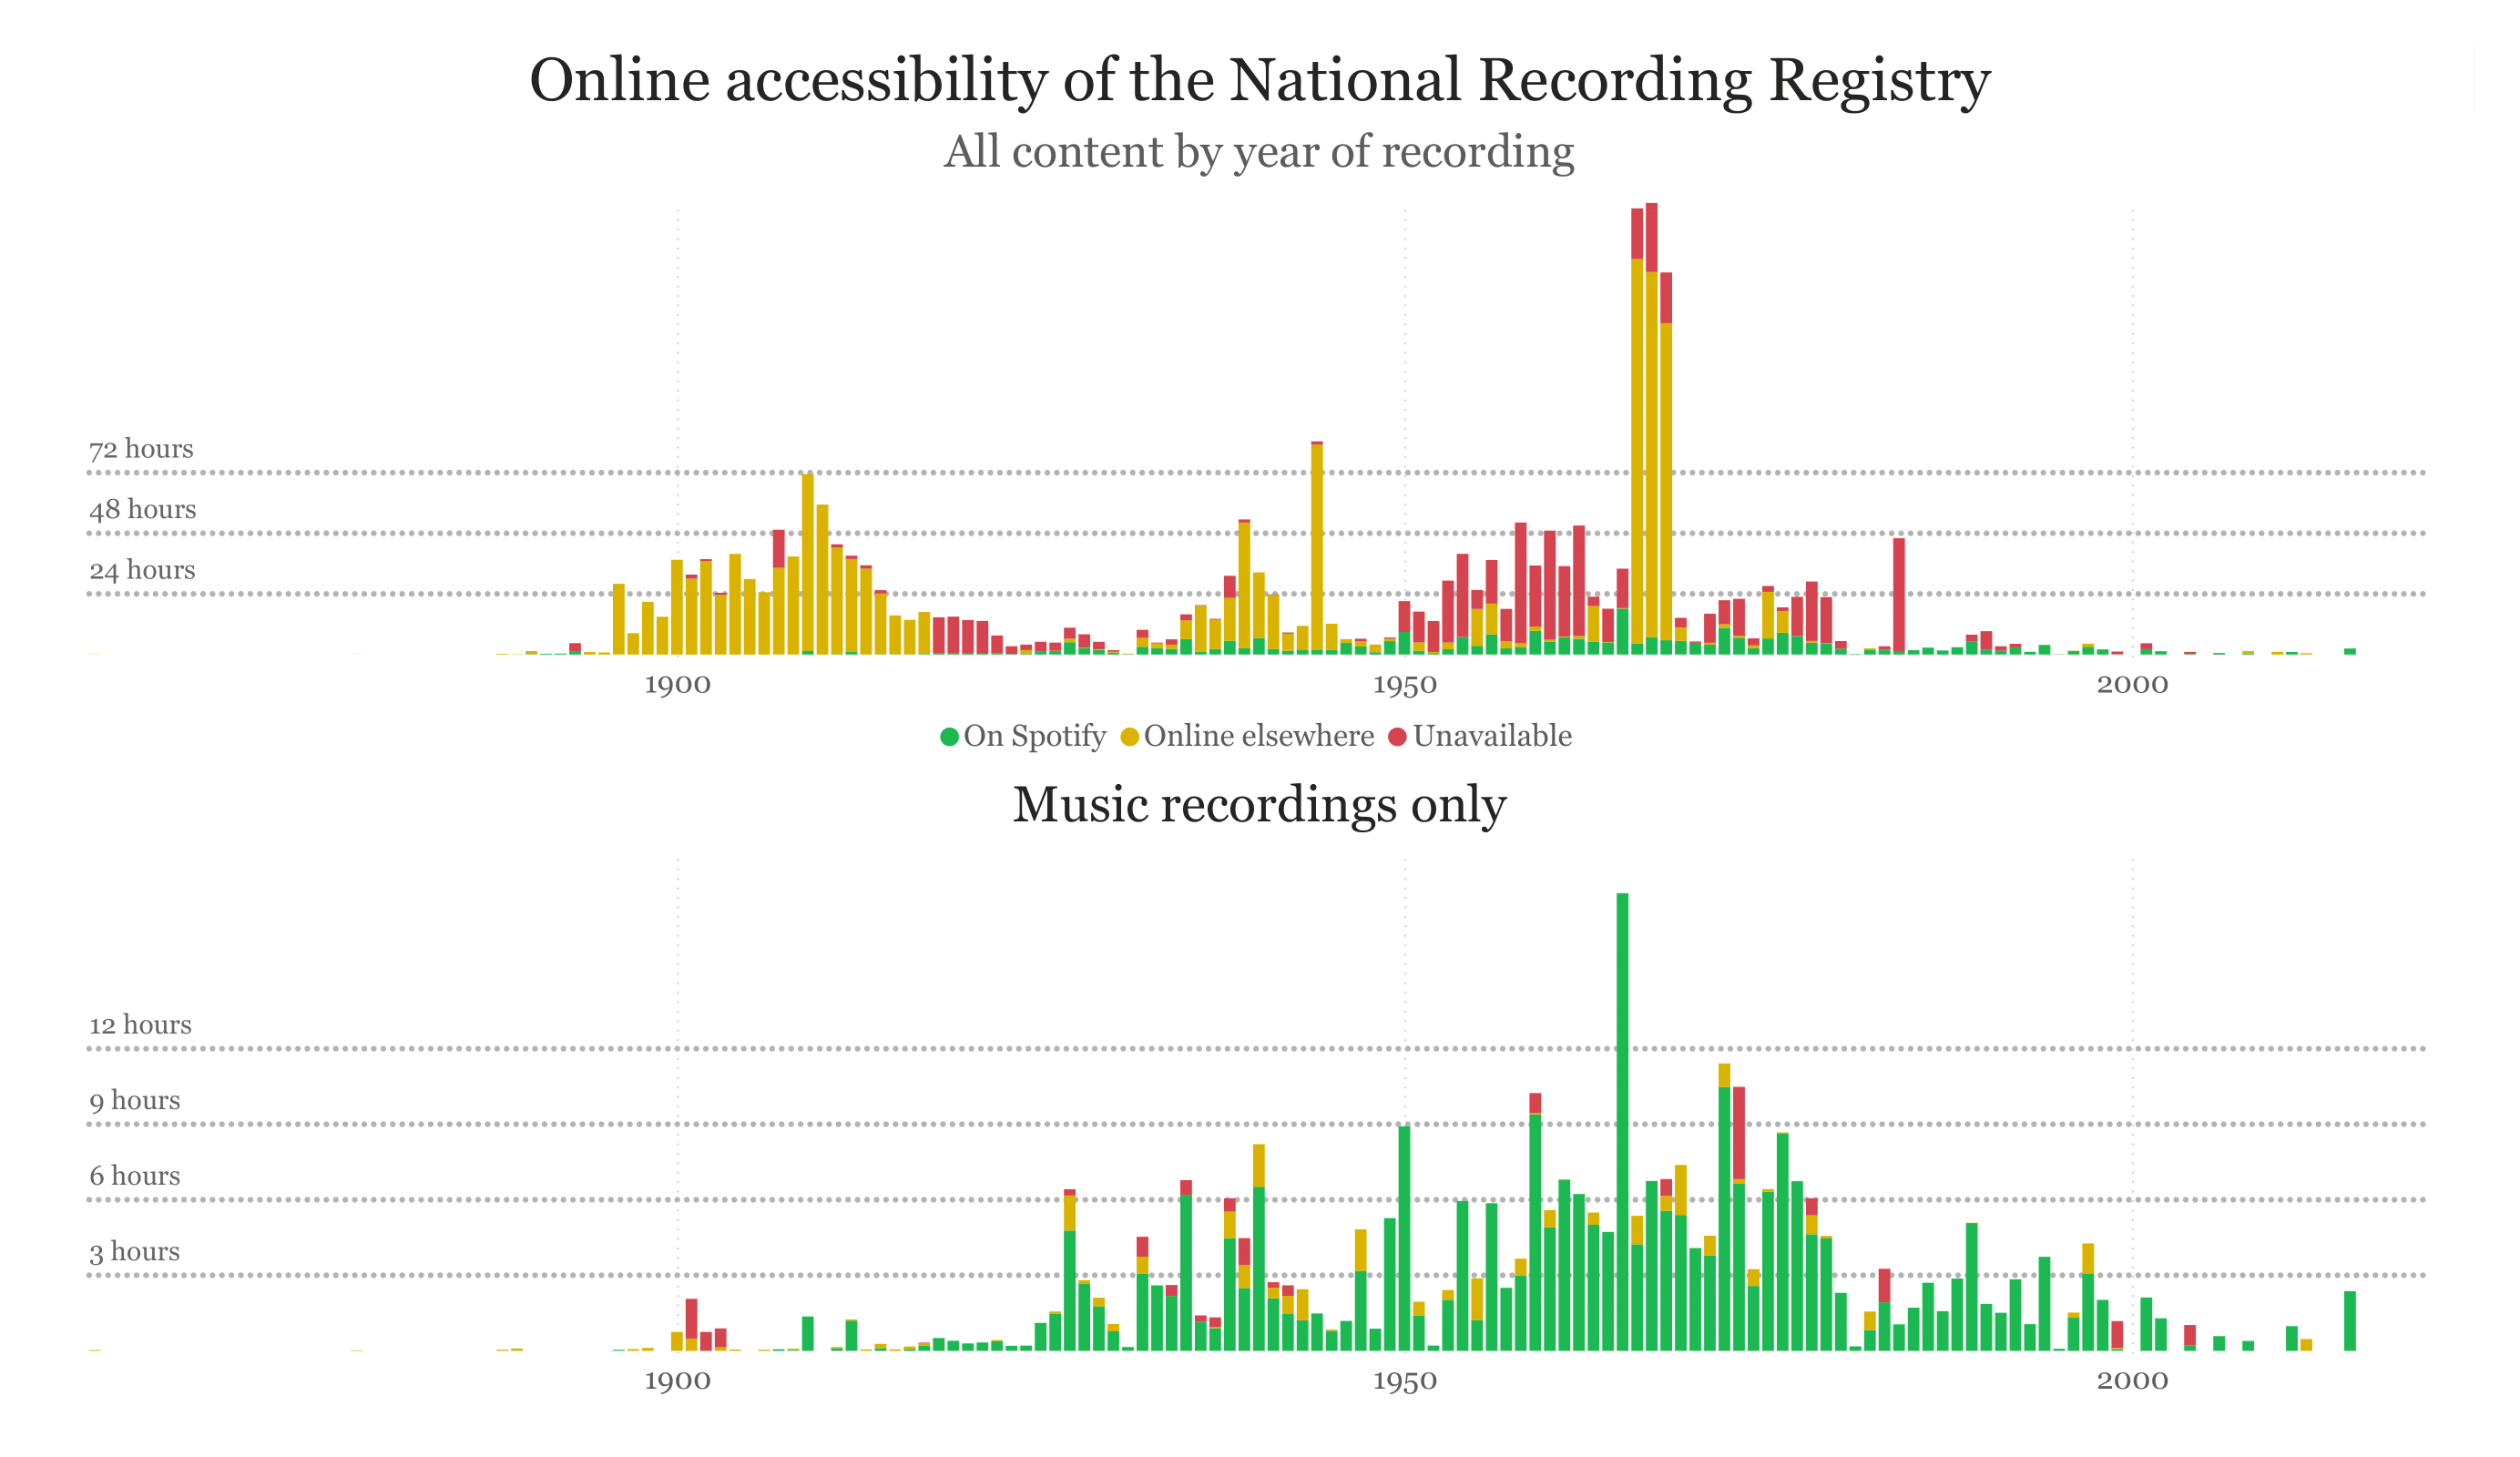
There are over 600 recordings in the registry, from different times and
different genres. Some are available for streaming on Spotify, others on
YouTube or the Internet Archive, others on dedicated websites, while some
collect dust undigitized in university archives. Some are single songs;
others collections of hundreds of hours of recordings.
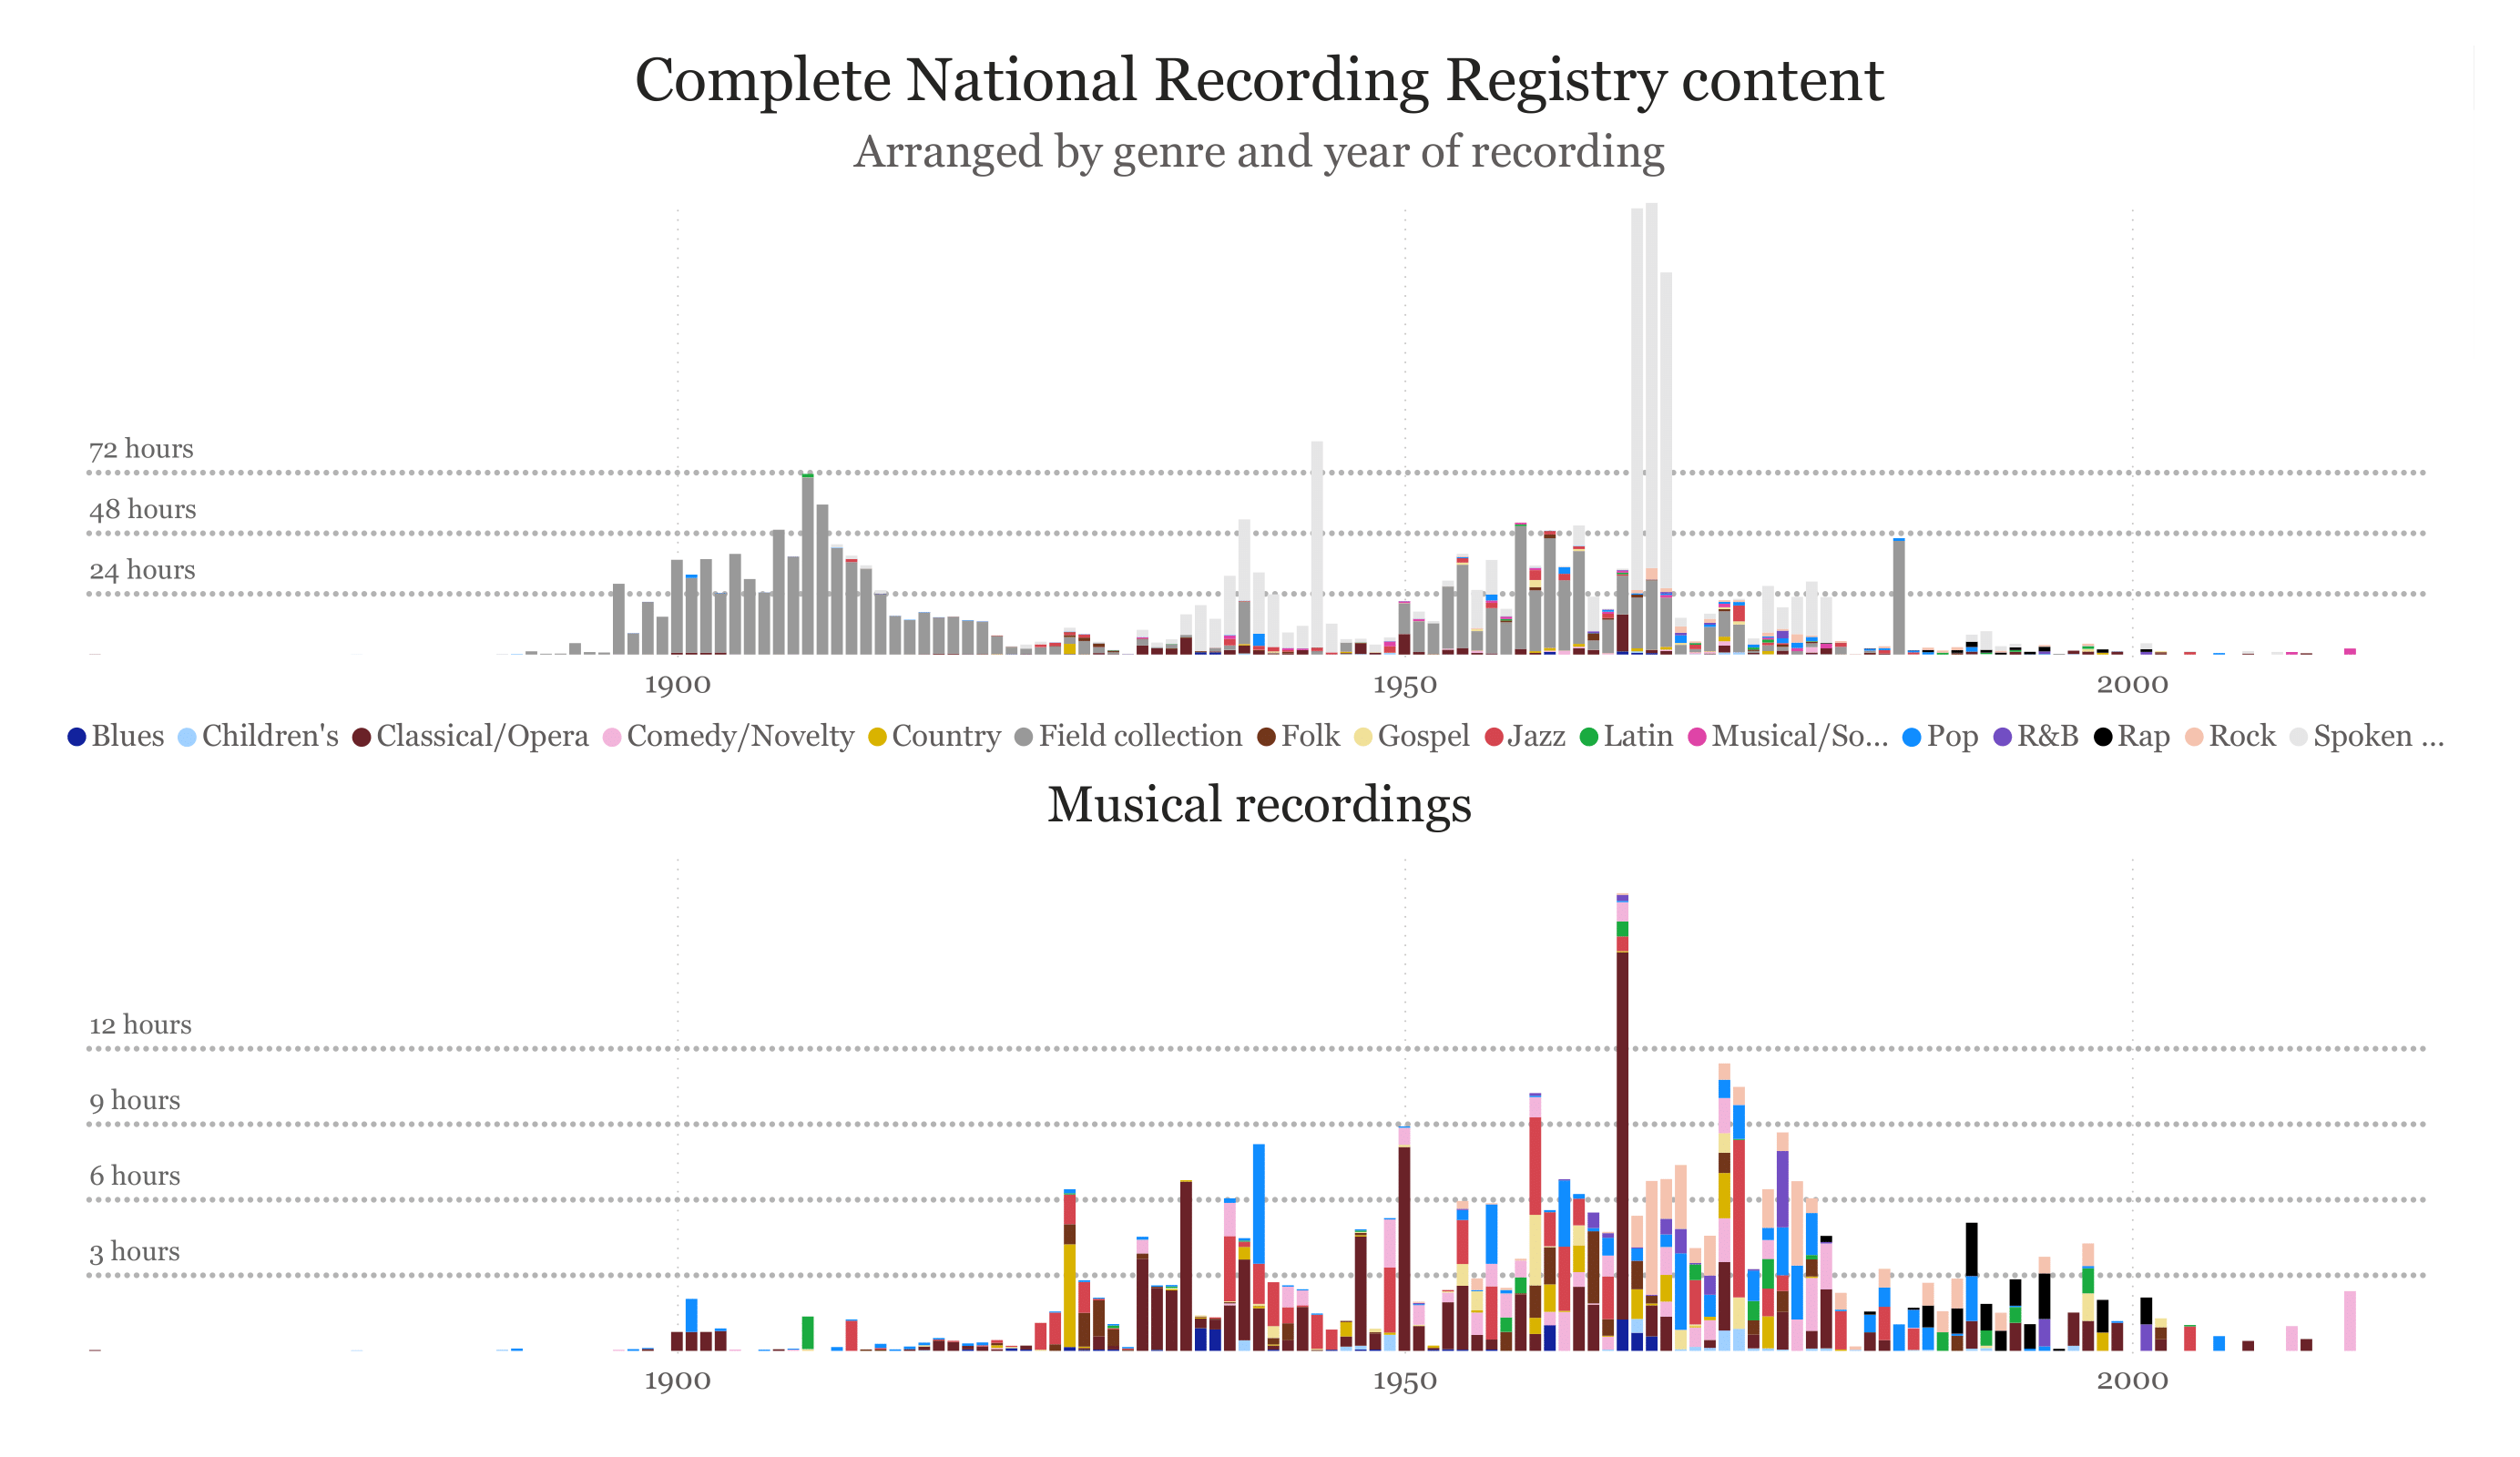
With the aid of PowerBI, I've developed some visuals demonstrating what, in
the broadest way, the recordings are composed of. If I paid for the full
version of PowerBI, the below might be a live-updating dashboard; as it happens,
this is a set of images depicting the Registry as of the 2025 inductions.
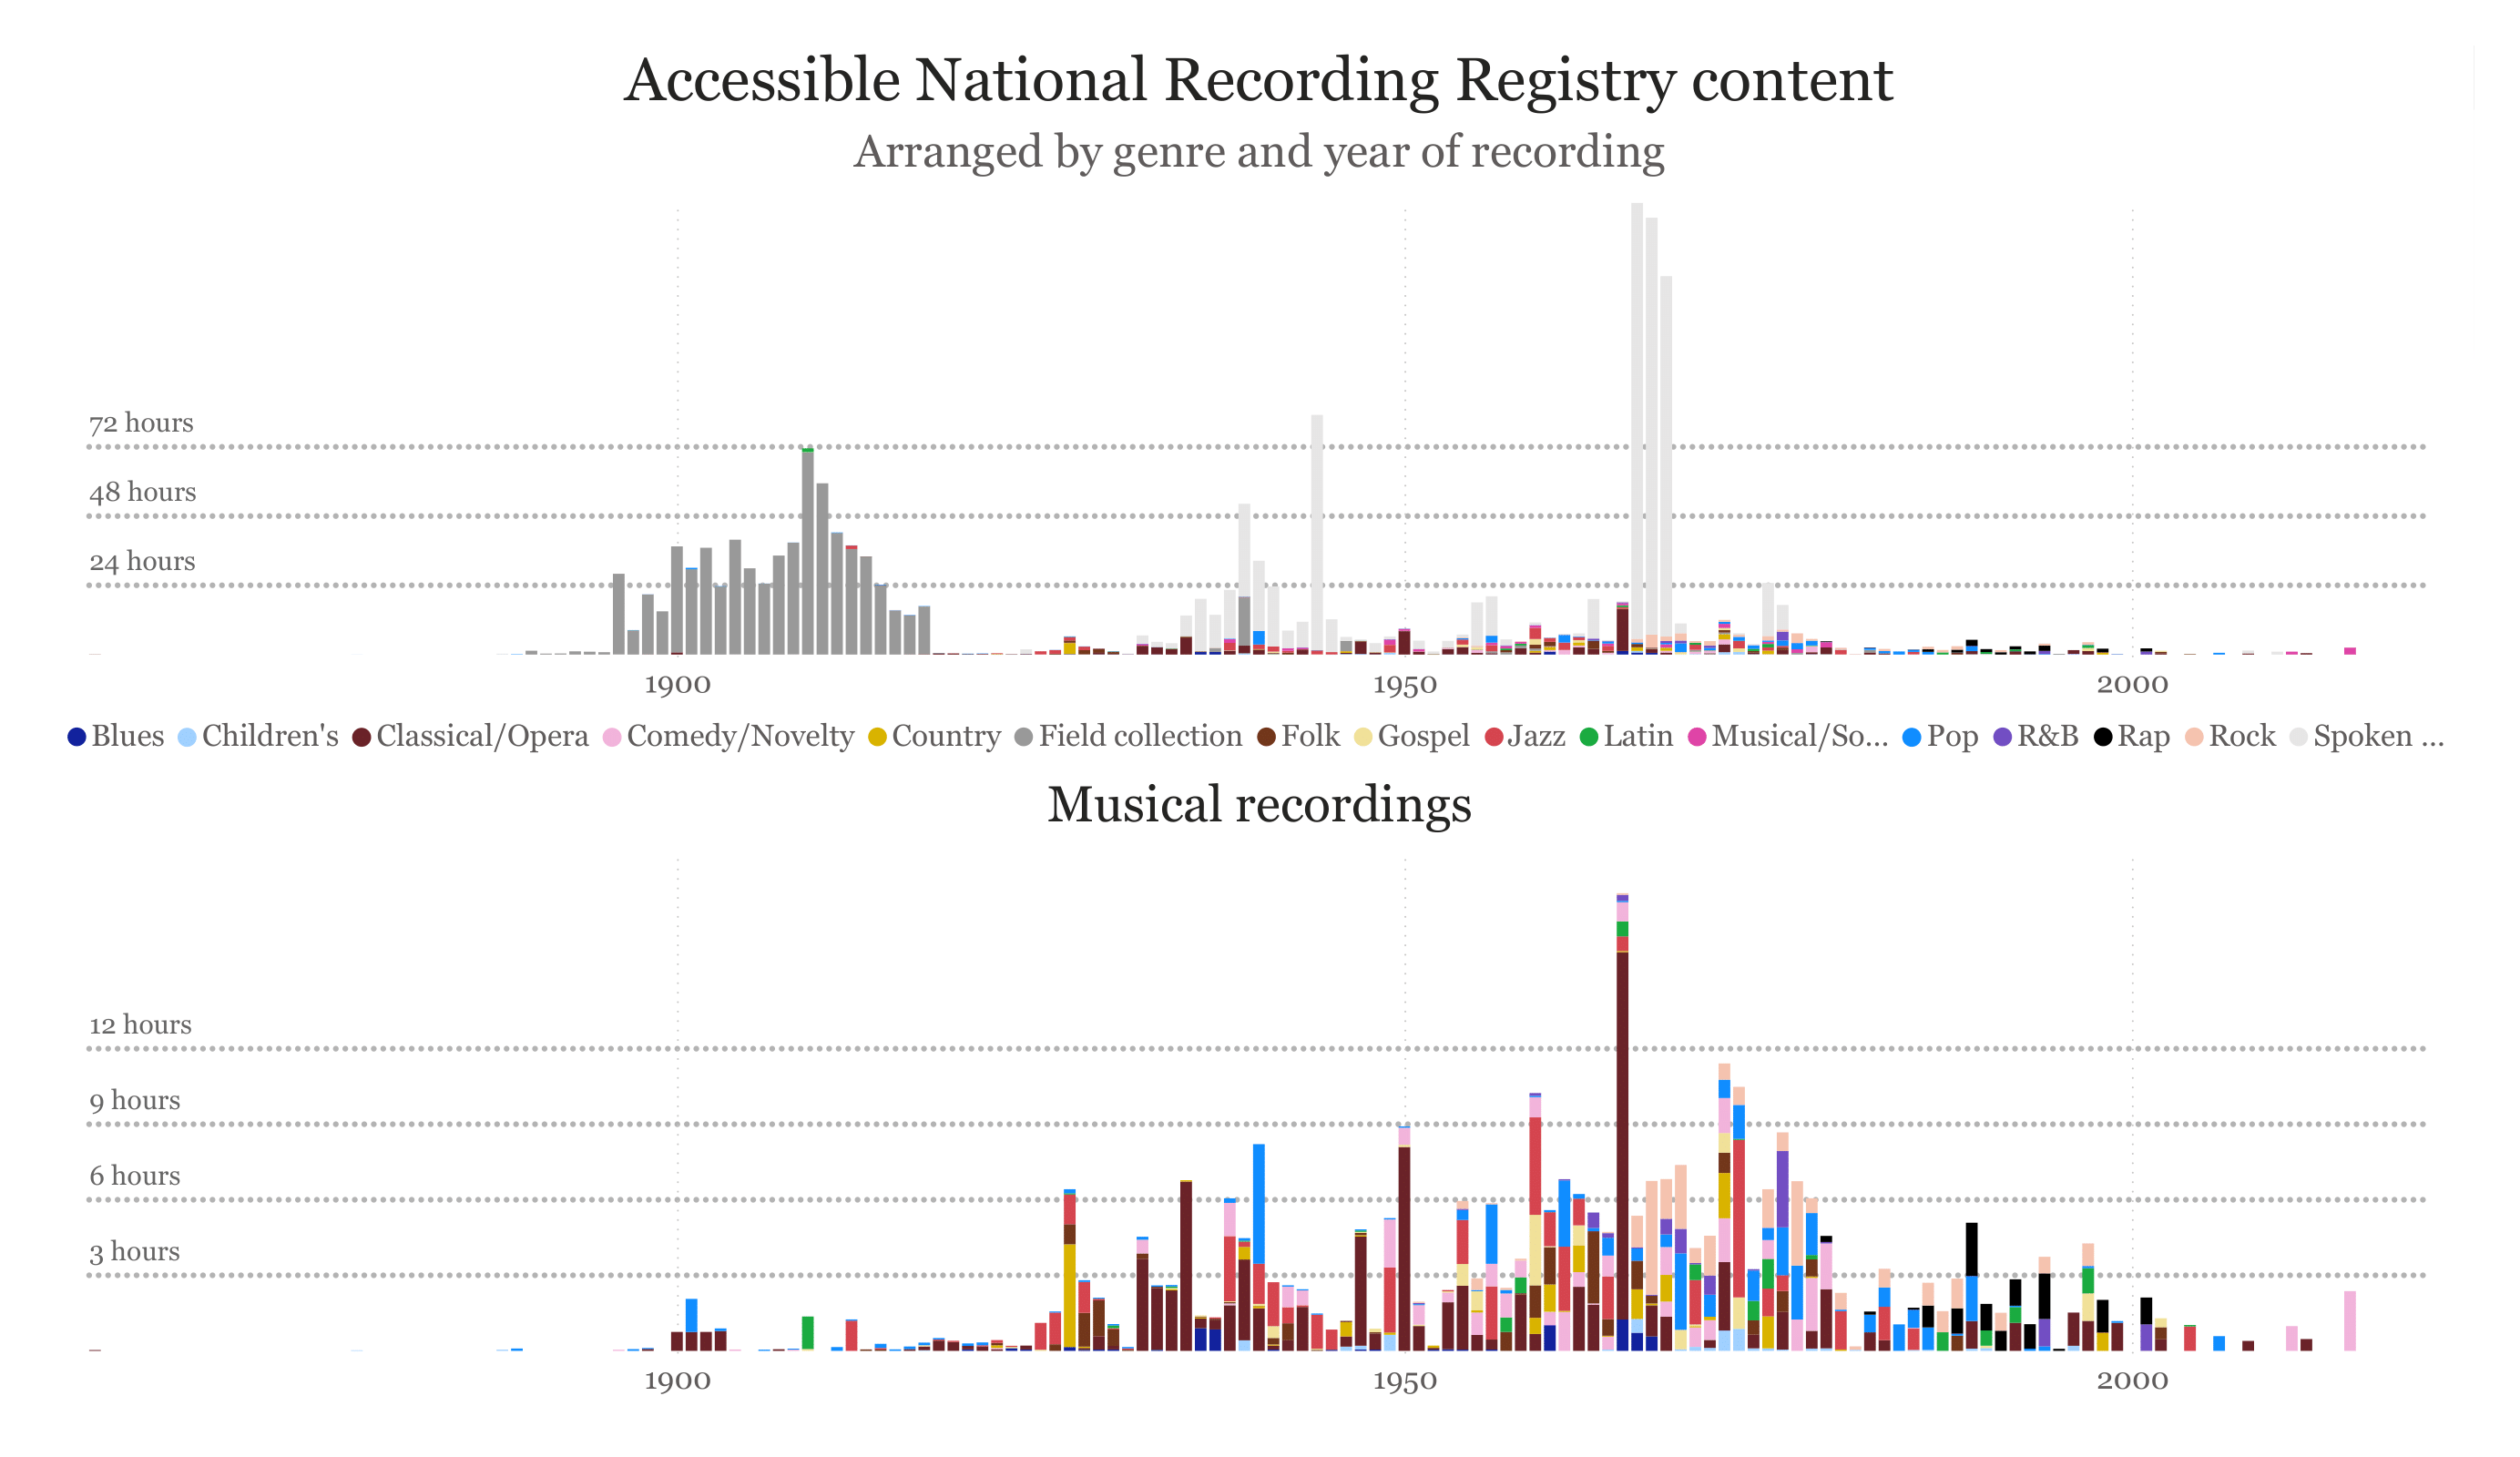
Genre choices
The Library of Congress's own choices for how to indicate genre have changed
over the years - sometimes fixing errors, sometimes seeking to be
more specific. My genre indicators are different from the Library's
for various reasons. Many categories were merged together
to allow the graphics below to be more easily read, for example:
- The Choral category was divided between Classical/Opera (Damnation of Faust, War Requiem, A Feather, and the U.S. Marine Band Concert), and Gospel. Chanticleer's Our American Journey was split among both those genres as well as Folk.
- The Environment and the Field categories were merged into the category of "Field collection".
- Singles from the Field category ("Listen to the Lambs", "Suncook Town Tragedy", "Bonaparte's Retreat", "Clifton's Crew") were marked as Folk, as were two commercially recorded Nimrod Workman albums.
- The Pop categories, and the Disco/Dance category, were merged into Pop.
- The Sports category was merged into "Spoken Word" (it used to have only one of the current sports entries).
- The Other category was removed: the Voyager record became a field collection; the Super Mario Bros. theme became a soundtrack.
- The Technology category was removed as it seemed like a catch-all. Its entries were labeled as Classical/Opera, Pop, Jazz, Children's, or Spoken Word according to their content.
In addition, some recordings were re-labeled (if a bit arbitrarily) to reflect
the timbre or other aspects of their contents.
- The Ali Akbar Khan selections - was marked as a field collection to reflect their unavailability.
- Some tracks of the Crescent City Archive were marked as Spoken Word because they are interviews; others remain jazz.
- The Voyager record remains entirely a Field collection, even though at least three of its recordings ("Dark Was the Night", "My Melancholy Blues", and Beethoven's String Quartet No. 13 V. Cavatina [by the Budapest strings]) appear as or in other entries in other genres.
- A Rock category was formed from various formerly Pop (Post-1955) or such recordings (excluding Aja, including Rumours, Déjà vu, The Band, and every album that might more obviously be labeled as Rock, and the early rock 'n' roll singles, Sun Sessions, and Grateful Dead concert).
- The R&B category was expanded to include Alicia Keys's Songs in A Minor, the Staple Singers' Soul Folk in Action, and Bill Withers's "Ain't No Sunshine".
- "The Revolution Will Not Be Televised" remains classified as R&B; although Rap and Spoken Word were both considered, no decision could be reached after many listenings.
- Latin was expanded to include "Rhythm is Gonna Get You," and Buena Vista Social Club (the latter was formerly "Musical/Soundtrack").
- The A Streetcar Named Desire soundtrack was changed from Blues to Musical/Soundtrack, as much of it is rather typical of a film soundtrack even if parts contain jazz; the Superfly soundtrack was already classified as Musical/Soundtrack though it sounds very much like R&B.